

“Which channel actually drove our sales this month?”
If you ask your team that question and the answer is “probably Instagram,” “a lot of people said they saw us on TikTok,” or — worse — “everything’s performing about the same,” you’re making budget decisions on a hunch. Proper marketing analytics attribution turns “probably” into numbers you can defend: channel A drives 40% of sales on 20% of spend, while channel B burns 30% of budget for 8% of sales.
This article builds that system from scratch for Indonesia’s 2026 market — proper GA4 setup, disciplined UTM tagging, the attribution basics (first-click, last-click, assisted), and a simple dashboard that answers the one question that matters: if I shift budget, what happens to sales?
Key Takeaways
- Marketing analytics = measuring every channel from click to sale, then using it for budget decisions — not just a colourful report.
- GA4 is the data foundation, but it’s only useful once conversion events and UTMs are set up correctly. GA4 without meaningful events = pretty charts, no decisions.
- UTM tagging is the language that tells GA4 the channel/source/campaign of each session. Without a disciplined naming convention, traffic lands in the “unassigned” bucket and your reports lie.
- Attribution: first-click praises discovery channels, last-click praises closing channels, assisted splits the credit. Never rely on a single model — compare at least two.
- Minimal dashboard: volume & cost per channel, conversions & value per channel, then efficiency (conversion rate, cost/conversion, ROAS). It must answer a budget question in 10 seconds.
Why Judging Channels “By Feel” Is Always Wrong
Judging channels by feel is always wrong because your brain counts the most visible channel, not the most productive one. Instagram feels like it’s “working” because you see comments and DMs every day; organic search feels “passive” because there’s no notification. In reality, their sales contributions can be the exact inverse of your perception.
In 2026, most Indonesian consumers’ purchase journeys pass through several digital touchpoints before a transaction — an ad on one platform, a review check on another, then a close on a third.1 Judging channels across this whole path, not just the final touch, is the core of proper customer-journey measurement.2 That means the sale you record under “last-click WhatsApp” was actually started upstream by another channel that never got credit. If you cut the upstream channel’s budget because it “doesn’t drive direct sales,” you’ve just switched off the engine that fills your funnel.
Here’s the stakes: a competitor who measures the full path knows exactly which channels deserve more budget and which deserve to be cut. They buy the same customers at a lower cost and scale faster, while you move budget based on whichever channel is loudest in your feed. Marketing analytics isn’t about being “data-literate” for its own sake — it’s about who holds the information advantage in the same auction.
💡 Tip: Test your team’s perception. Before opening the dashboard, have everyone write down a guess: what percentage of sales comes from each channel. Then compare against the real numbers. The gap between the guess and the data is the measure of how blind your budget decisions have been.
How to Set Up GA4 Correctly for Decision-Making
A correct GA4 setup isn’t one that’s “installed” — it’s one whose conversion events are meaningful and can be tied back to sales. Dropping in a GA4 tag and staring at a session graph is the most common mistake: sessions are not sales.
The minimum foundation you need:
- Install GA4 via Google Tag / GTM, not hand-pasted across pages. This avoids duplicate hits and lets you add events without touching code repeatedly.
- Define conversion events that mean money. For lead-gen:
generate_lead,whatsapp_click,form_submit. For e-commerce:purchasewithvalueandcurrency(IDR) parameters. A “scroll 90%” event is diagnostic, not a conversion — don’t mark it as one. - Send transaction value, not just conversion counts. GA4 that knows
valuecan compute revenue per channel; GA4 that only counts “10 conversions” can’t tell 10 sales of Rp 50,000 from 10 sales of Rp 5 million. - Link Google Ads and tag WhatsApp/marketplace referrals. In Indonesia, many deals close on WhatsApp or a marketplace — make sure outbound clicks there are captured as events so they don’t vanish from attribution.
One architecture decision that’s often skipped: separate micro-conversions (WhatsApp click, price view, add-to-cart) from macro-conversions (the actual sale). Micro-conversions help you diagnose where the funnel leaks; macro-conversions are what you use for budget decisions. Mixing the two makes your “conversion rate” meaningless.
📌 Important: Before you trust any GA4 number, run a validation test — complete one test purchase/lead and confirm the event appears in the Realtime report with the correct
value. Wrong data is more dangerous than no data, because you’ll make big decisions with full confidence on top of numbers that are simply false.
UTM Tagging: The Language That Tells GA4 Which Channel
UTM tagging is the set of parameters you append to a campaign link so GA4 knows exactly which channel, source, and campaign sent each session. Without UTMs, your paid and referral traffic falls into the “direct” or “unassigned” bucket — and your channel report is automatically a lie.
The five standard parameters:
| Parameter | Purpose | Example |
|---|---|---|
utm_source | The origin platform | instagram, tiktok, google |
utm_medium | The channel type | cpc, social, email, referral |
utm_campaign | The campaign name | promo-sept-2026 |
utm_content | Creative/link variant | video-a, banner-b |
utm_term | Keyword (paid search) | web-design-tangerang |
What separates useful analytics from a mess isn’t the presence of UTMs — it’s naming consistency. Instagram, instagram, and IG are counted as three different sources by GA4 — and suddenly one channel splinters into three rows that all look small. Non-negotiable rules:
- Always lowercase, no spaces (use hyphens).
- Write down a convention and keep one master UTM spreadsheet the whole team uses.
- Be consistent on
medium: paid social =cpcorpaid-social, don’t mix; email =email, notnewsletterfor one campaign andmailerfor another.
For Indonesian local businesses, also tag your bio link, your Google Business Profile link, and your WhatsApp Business broadcast links — these are the channels most often “lost” to direct because they’re never tagged. High-quality local organic traffic also structurally lowers your acquisition cost, a pattern we cover in user behaviour signals that drive local SEO.
Attribution Basics: First-Click, Last-Click, and Assisted
Attribution is the rule for which channel gets credit for a sale when a customer touches many channels before buying. Pick the wrong model and you praise the wrong channel and cut the very one filling your funnel.
The three ways of thinking you must understand:
- First-click gives 100% credit to the first channel that introduced the customer to your brand. Good for judging discovery channels — usually content, awareness, and non-brand search. Its flaw: it over-praises the top of the funnel and ignores what closed the deal.
- Last-click gives 100% credit to the last channel before conversion. It tends to praise closing channels — brand search, retargeting, WhatsApp clicks. Its flaw: it pretends awareness contributed nothing, when awareness is what started the path.
- Assisted / position-based / data-driven splits credit across every channel that contributed along the path. This is closest to reality, but it needs enough data volume to be stable.3
A concrete example: a customer sees your TikTok video (first touch), three days later searches your brand on Google (assist), then closes via a WhatsApp click from your website (last touch).
| Attribution model | TikTok | Google Brand | |
|---|---|---|---|
| First-click | 100% | 0% | 0% |
| Last-click | 0% | 0% | 100% |
| Linear (assisted) | 33% | 33% | 33% |
Those three models tell wildly different stories about the same channels. The fatal mistake is running your entire budget decision on last-click alone — which systematically defunds TikTok/content because it “doesn’t drive direct sales,” even though that channel started every path. The practical rule: never judge a channel with a single model. Open first-click and last-click side by side; the gap between them is your demand-building channels versus your demand-harvesting channels.
How to Build a Simple Marketing Dashboard
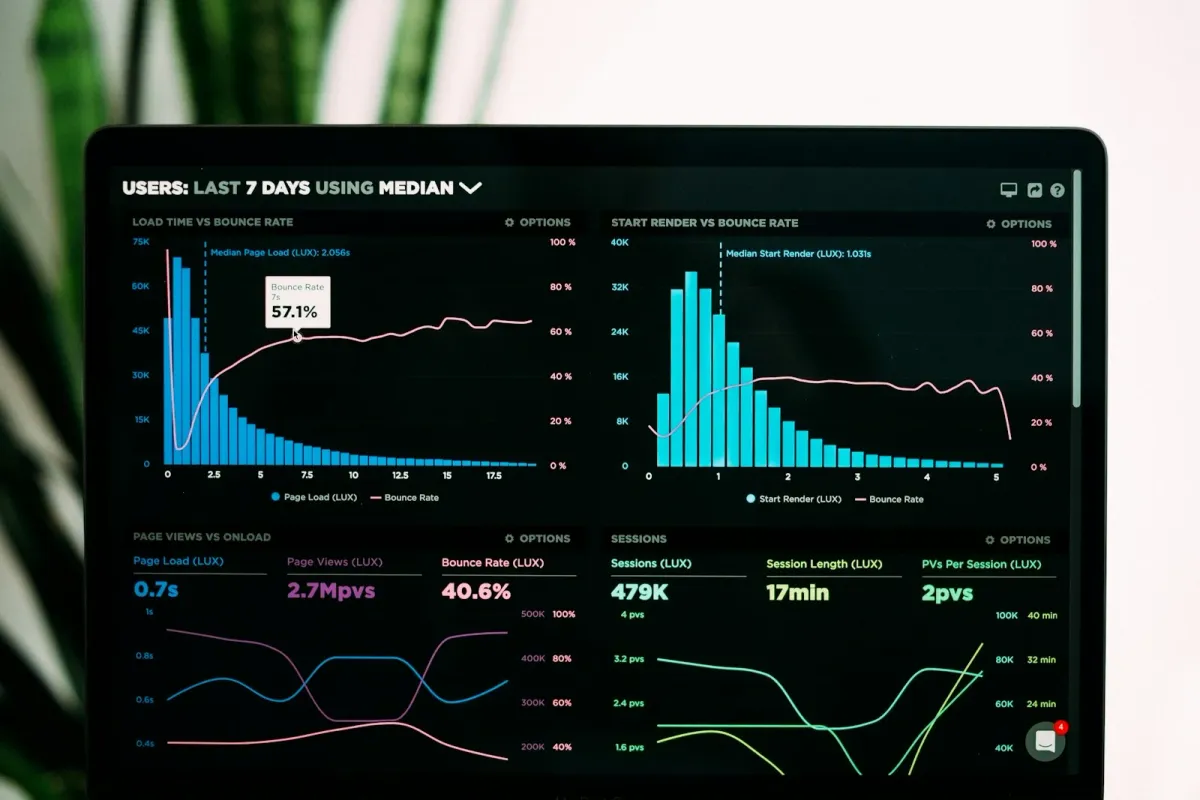
A good marketing dashboard answers one question in ten seconds: if I shift budget to this channel, what happens to sales? If your dashboard takes five minutes to interpret, it’s a report, not a decision tool.
The three layers you need, left to right:
- Volume & cost per channel — sessions/clicks and ad spend. Answers “how big is this channel and what does it cost.”
- Conversions & value per channel — lead/sale counts and revenue. Answers “what does this channel produce.”
- Efficiency (derived) — conversion rate, cost per conversion, and ROAS. Answers “how efficient is this channel” — and this is the column that drives decisions.
An example dashboard row you can act on immediately:
| Channel | Spend | Conversions | Revenue | Cost/Conv | ROAS |
|---|---|---|---|---|---|
| Meta Ads | Rp 10M | 50 | Rp 40M | Rp 200K | 4.0x |
| Google Ads | Rp 8M | 32 | Rp 38M | Rp 250K | 4.75x |
| TikTok | Rp 6M | 18 | Rp 15M | Rp 333K | 2.5x |
| SEO/Organic | Rp 0* | 24 | Rp 22M | ~Rp 0 | — |
*SEO still has a cost (content, time), but no cost-per-click — which is exactly why this channel lowers your blended CAC.
The tooling doesn’t need to be expensive: Looker Studio (free) pulling from GA4 and Google Ads covers 90% of Indonesian businesses. The keys to readability: one row per channel, conditional formatting on the efficiency columns (green/red), and one comparison date (this period vs last) so you see direction, not just a static number. To pick the supporting tools that fit your scale, we compare the options in the best local SEO tools of 2026.
One discipline principle: don’t show metrics that won’t change a decision. Reach and impressions can live in a diagnostic tab, but keep them off the decision dashboard — the more unbankable numbers you show, the slower you decide.
From Data to Budget Decisions You Can Defend
Data is only useful if it ends in a decision, and the right decision follows a simple pattern: shift budget away from low-ROAS, low-assist channels toward efficient ones, while protecting the discovery channels that fill the funnel even when their last-click looks small.
A weekly decision framework:
| Channel condition | Diagnosis | Decision |
|---|---|---|
| High ROAS, high first-click too | Core acquisition engine | Increase budget gradually |
| Low ROAS, but high first-click | Discovery/demand channel | Keep it — it fills the funnel |
| Low ROAS, low first-click & assist | Money burner | Reduce/turn off |
| High conversions but rising cost/conv | Audience fatigue | Refresh creative, don’t add budget |
Note the second row: this is the channel most often cut in error by businesses reading last-click only. Mature marketing analytics stays your hand from that mistake.
How Eranya Digital Helps You Stop Guessing
The problem is rarely “not enough data” — it’s more often misconfigured data and an untrackable funnel. GA4 with meaningless conversion events, inconsistent UTMs, and a website that doesn’t send transaction value will produce a dashboard that looks convincing but leads you to the wrong decision.
At Eranya Digital, we build the measurement foundation from the website layer up: GA4 with correct conversion events, a disciplined UTM convention, WhatsApp and marketplace click tracking so closes don’t vanish from attribution, and a Looker Studio dashboard you can read in ten seconds. We don’t sell “reach.” We sell a measurement system that makes every budget decision defensible in front of the numbers.
Want to know which channel actually drives your sales? We offer a free marketing audit: we inspect your GA4 and UTM setup, map your channel attribution, and show you where budget is leaking. Book your free marketing audit now →
References
<script type="application/ld+json">
[
  {
    "@context": "https://schema.org",
    "@type": "Article",
    "headline": "Marketing Analytics Attribution: GA4, UTM & Decisions",
    "description": "A 2026 guide to marketing analytics attribution: GA4 setup, UTM tagging, first/last/assisted attribution basics, and how to build a simple dashboard so you know which channel actually drives sales.",
    "image": "https://eranya.digital/images/blog/sinyal-perilaku-pengguna.webp",
    "author": {"@type": "Organization", "name": "Eranya Digital", "url": "https://eranya.digital"},
    "publisher": {"@type": "Organization", "name": "PT Eranya Digital Nusantara", "logo": {"@type": "ImageObject", "url": "https://eranya.digital/images/logo.png"}},
    "datePublished": "2026-09-12",
    "dateModified": "2026-09-12",
    "mainEntityOfPage": {"@type": "WebPage", "@id": "https://eranya.digital/blog/marketing-analytics-ga4-attribution/"},
    "inLanguage": "en-US",
    "keywords": ["marketing analytics attribution", "GA4 setup for business", "UTM tagging best practice", "first-click vs last-click attribution", "simple marketing dashboard"],
    "articleSection": "Strategi"
  },
  {
    "@context": "https://schema.org",
    "@type": "FAQPage",
    "mainEntity": [
      {"@type": "Question", "name": "What is marketing analytics and why does it matter for decisions?", "acceptedAnswer": {"@type": "Answer", "text": "Marketing analytics is the practice of collecting, measuring, and interpreting data from every marketing channel so you can allocate budget on evidence instead of guesswork. Without proper measurement you don't know which channel drives sales and which one just spends money. In 2026, most purchase journeys in Indonesia pass through several digital touchpoints before a transaction, so judging channels by feel is almost always wrong."}},
      {"@type": "Question", "name": "What is the difference between first-click, last-click, and assisted attribution?", "acceptedAnswer": {"@type": "Answer", "text": "First-click gives all credit to the channel that first introduced a customer to your brand, good for judging discovery channels. Last-click gives all credit to the final channel before conversion, tending to praise closing channels like brand search or retargeting. Assisted attribution splits credit across every channel that contributed along the path. Using one model alone is misleading; healthy decisions compare at least two models side by side."}},
      {"@type": "Question", "name": "Do I still need UTM tagging if I already use GA4?", "acceptedAnswer": {"@type": "Answer", "text": "Yes, more than ever. GA4 can only group traffic correctly if every campaign link is tagged with consistent UTMs. Without UTMs, a lot of paid and referral traffic falls into the direct or unassigned bucket, making channel reports wrong. UTMs are the language that tells GA4 which channel, source, and campaign sent each session — a disciplined naming convention is the foundation of your entire attribution."}},
      {"@type": "Question", "name": "What should a minimal marketing analytics dashboard show?", "acceptedAnswer": {"@type": "Answer", "text": "At minimum it should show three things: volume and cost per channel (sessions, clicks, spend), conversions and conversion value per channel (leads, sales, revenue), and the derived efficiency (conversion rate, cost per conversion, ROAS). Ideally add a first-click vs last-click comparison so you see discovery and closing channels at once. A good dashboard answers one question in ten seconds: if I shift budget to this channel, what happens to sales?"}}
    ]
  }
]
</script>
Footnotes
-
DataReportal. (2026). Digital 2026: Indonesia (in partnership with We Are Social). datareportal.com/reports/digital-2026-indonesia — Trends in digital adoption and multi-channel purchase journeys in Indonesia. ↩
-
Think with Google. Measuring Marketing ROI and the customer journey — A general framework for measuring the customer journey and the importance of judging channels across the whole path, not just the final touch. thinkwithgoogle.com ↩
-
Google. Analytics Help — [GA4] About attribution and attribution models. support.google.com/analytics — Official reference for first-click, last-click, and data-driven attribution models in GA4. ↩
Common Questions About Marketing Analytics & Attribution
What is marketing analytics and why does it matter for decisions?
Marketing analytics is the practice of collecting, measuring, and interpreting data from every marketing channel so you can allocate budget on evidence instead of guesswork. It matters because without proper measurement you don't know which channel drives sales and which one just spends money. In 2026, most purchase journeys in Indonesia pass through several digital touchpoints before a transaction, so judging channels by feel is almost always wrong.
What is the difference between first-click, last-click, and assisted attribution?
First-click gives all credit to the channel that first introduced a customer to your brand, which makes it good for judging discovery channels. Last-click gives all credit to the final channel before conversion, which tends to praise closing channels like brand search or retargeting. Assisted (or position-based/data-driven) attribution splits credit across every channel that contributed along the path. Using only one model is misleading; healthy decisions compare at least two models side by side.
Do I still need UTM tagging if I already use GA4?
Yes, more than ever. GA4 can only group traffic correctly if every campaign link is tagged with consistent UTMs. Without UTMs, a lot of paid and referral traffic falls into the 'direct' or 'unassigned' bucket, which makes your channel reports wrong. UTMs are the language that tells GA4 which channel, source, and campaign sent each session — a disciplined naming convention is the foundation of your entire attribution.
What should a minimal marketing analytics dashboard show?
At minimum it should show three things: volume and cost per channel (sessions, clicks, spend), conversions and conversion value per channel (leads, sales, revenue), and the derived efficiency (conversion rate, cost per conversion, ROAS). Ideally add a first-click vs last-click comparison so you see discovery channels and closing channels at once. A good dashboard answers one question in ten seconds: if I shift budget to this channel, what happens to sales?